Markets
The $86 Trillion World Economy in One Chart
Check out the latest 2023 update of the world economy in one chart.
The $86 Trillion World Economy in One Chart
Check out the latest 2023 update of the world economy by country GDPs in one chart.
The world economy is in a never-ending state of flux.
The fact is that billions of variables — both big and small — factor into any calculation of overall economic productivity, and these inputs are changing all of the time.
Buying this week’s groceries or filling up your car with gas may seem like a rounding error when we are talking about trillions of dollars, but every microeconomic decision or set of preferences can add up in aggregate.
And as consumer preferences, technology, trade relationships, interest rates, and currency valuations change — so does the final composition of the world’s $86 trillion economy.
Country GDPs, by Size
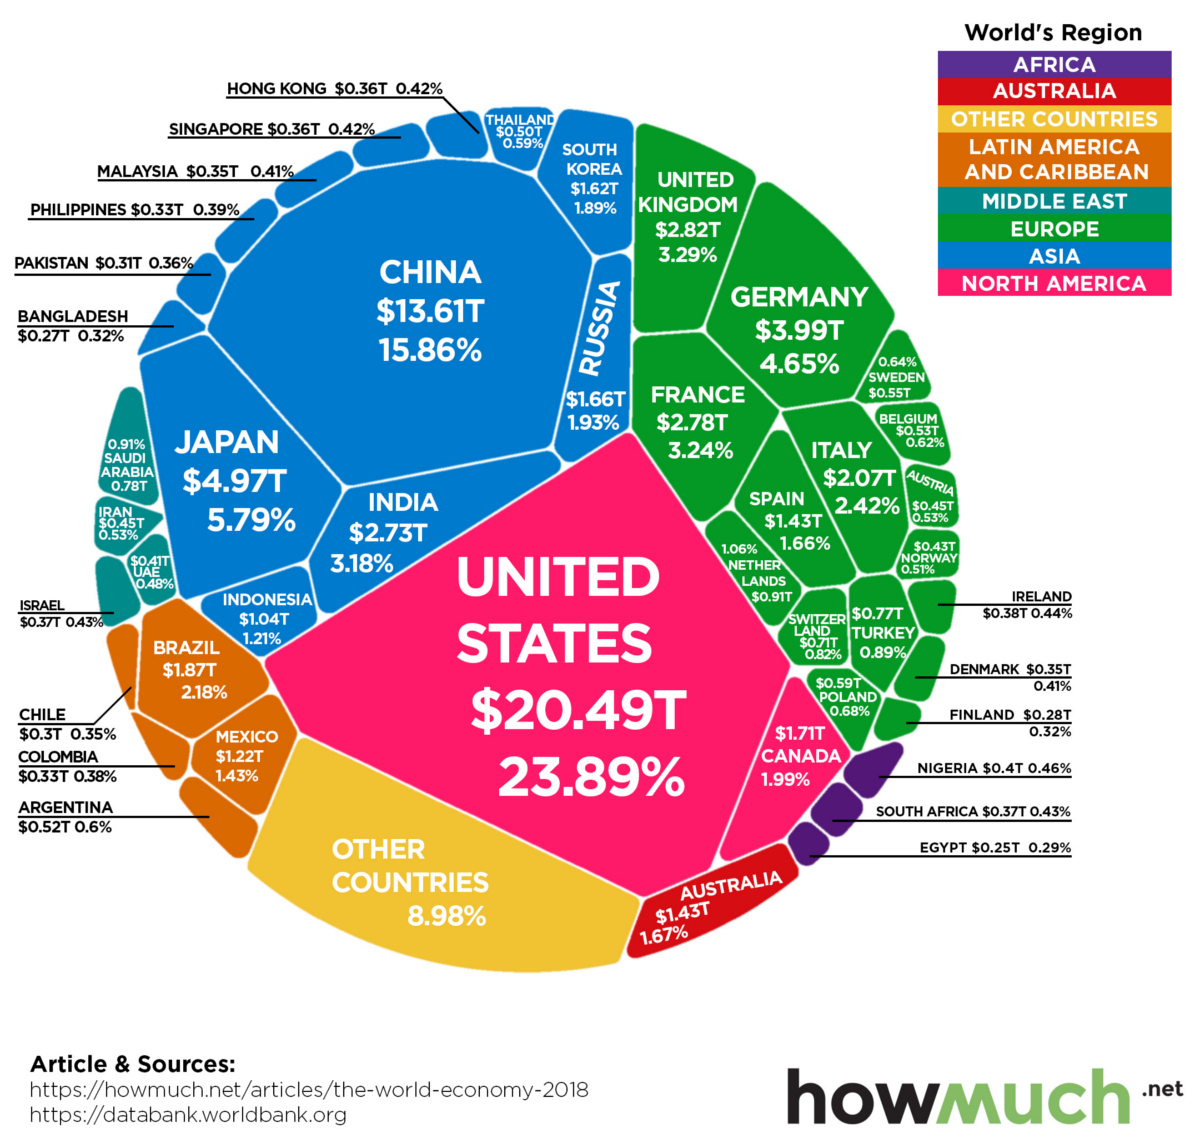
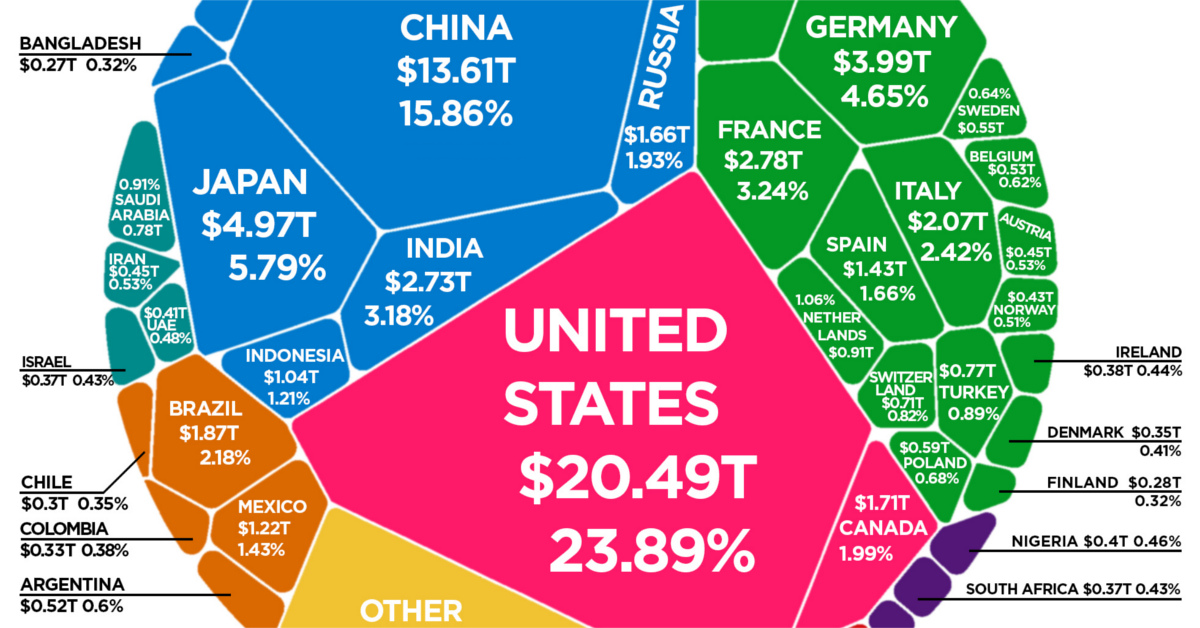
Today’s visualization comes to us from HowMuch.net, and it charts the most recent composition of the global economic landscape.
It should be noted that the diagram uses nominal GDP to measure economic output, which is different than using GDP adjusted for purchasing power parity (PPP). The data in the diagram and table below come from the World Bank’s latest update, published in July 2019.
The Top 15 Economies, by GDP
| Rank | Country | GDP (Nominal, USD) | Share of World Total (%) |
|---|---|---|---|
| #1 | 🇺🇸 United States | $20.49 trillion | 23.89% |
| #2 | 🇨🇳 China | $13.61 trillion | 15.86% |
| #3 | 🇯🇵 Japan | $4.97 trillion | 5.79% |
| #4 | 🇩🇪 Germany | $4.00 trillion | 4.66% |
| #5 | 🇬🇧 United Kingdom | $2.83 trillion | 3.29% |
| #6 | 🇫🇷 France | $2.78 trillion | 3.24% |
| #7 | 🇮🇳 India | $2.73 trillion | 3.18% |
| #8 | 🇮🇹 Italy | $2.07 trillion | 2.42% |
| #9 | 🇧🇷 Brazil | $1.87 trillion | 2.18% |
| #10 | 🇨🇦 Canada | $1.71 trillion | 1.99% |
| #11 | 🇷🇺 Russian Federation | $1.66 trillion | 1.93% |
| #12 | 🇰🇷 Korea, Rep. | $1.62 trillion | 1.89% |
| #13 | 🇦🇺 Australia | $1.43 trillion | 1.67% |
| #14 | 🇪🇸 Spain | $1.43 trillion | 1.66% |
| #15 | 🇲🇽 Mexico | $1.22 trillion | 1.43% |
The above 15 economies represent a whopping 75% of total global GDP, which added up to $85.8 trillion in 2018 according to the World Bank.
Most interestingly, the gap between China and the United States is narrowing — and in nominal terms, China’s economy is now 66.4% the size.
A Higher Level Look
The World Bank also provides a regional breakdown of global GDP, which we helps to give additional perspective:
| Rank | Geographic Region | GDP (Nominal, USD) | Global Share |
|---|---|---|---|
| #1 | East Asia & Pacific | $25.9 trillion | 30.2% |
| #2 | Europe & Central Asia | $23.0 trillion | 26.8% |
| #3 | North America | $22.2 trillion | 25.9% |
| #4 | Latin America & Caribbean | $5.8 trillion | 6.8% |
| #5 | Middle East & North Africa | $3.6 trillion | 4.2% |
| #6 | South Asia | $3.5 trillion | 4.1% |
| #7 | Sub-Saharan Africa | $1.7 trillion | 2.0% |
| World Total | $85.8 trillion | 100.0% |
The organization breaks it down by income levels, as well:
| Income Level | GDP (Nominal, USD) | Global Share |
|---|---|---|
| High income countries | $54.1 trillion | 63.1% |
| Upper middle income countries | $24.4 trillion | 28.4% |
| Lower middle income countries | $6.7 trillion | 7.8% |
| Low income countries | $0.6 trillion | 0.7% |
| World total | $85.8 trillion | 100.00% |
The low income countries — which have a combined population of about 705 million people — add up to only 0.6% of global GDP.
Looking Towards the Future
For more on the world economy and predictions on country GDPs on a forward-looking basis, we suggest looking at our animation on the Biggest Economies in 2030.
It is worth mentioning, however, that the animation uses GDP (PPP) calculations instead of the nominal ones above.


Markets
U.S. Debt Interest Payments Reach $1 Trillion
U.S. debt interest payments have surged past the $1 trillion dollar mark, amid high interest rates and an ever-expanding debt burden.


U.S. Debt Interest Payments Reach $1 Trillion
This was originally posted on our Voronoi app. Download the app for free on iOS or Android and discover incredible data-driven charts from a variety of trusted sources.
The cost of paying for America’s national debt crossed the $1 trillion dollar mark in 2023, driven by high interest rates and a record $34 trillion mountain of debt.
Over the last decade, U.S. debt interest payments have more than doubled amid vast government spending during the pandemic crisis. As debt payments continue to soar, the Congressional Budget Office (CBO) reported that debt servicing costs surpassed defense spending for the first time ever this year.
This graphic shows the sharp rise in U.S. debt payments, based on data from the Federal Reserve.
A $1 Trillion Interest Bill, and Growing
Below, we show how U.S. debt interest payments have risen at a faster pace than at another time in modern history:
| Date | Interest Payments | U.S. National Debt |
|---|---|---|
| 2023 | $1.0T | $34.0T |
| 2022 | $830B | $31.4T |
| 2021 | $612B | $29.6T |
| 2020 | $518B | $27.7T |
| 2019 | $564B | $23.2T |
| 2018 | $571B | $22.0T |
| 2017 | $493B | $20.5T |
| 2016 | $460B | $20.0T |
| 2015 | $435B | $18.9T |
| 2014 | $442B | $18.1T |
| 2013 | $425B | $17.2T |
| 2012 | $417B | $16.4T |
| 2011 | $433B | $15.2T |
| 2010 | $400B | $14.0T |
| 2009 | $354B | $12.3T |
| 2008 | $380B | $10.7T |
| 2007 | $414B | $9.2T |
| 2006 | $387B | $8.7T |
| 2005 | $355B | $8.2T |
| 2004 | $318B | $7.6T |
| 2003 | $294B | $7.0T |
| 2002 | $298B | $6.4T |
| 2001 | $318B | $5.9T |
| 2000 | $353B | $5.7T |
| 1999 | $353B | $5.8T |
| 1998 | $360B | $5.6T |
| 1997 | $368B | $5.5T |
| 1996 | $362B | $5.3T |
| 1995 | $357B | $5.0T |
| 1994 | $334B | $4.8T |
| 1993 | $311B | $4.5T |
| 1992 | $306B | $4.2T |
| 1991 | $308B | $3.8T |
| 1990 | $298B | $3.4T |
| 1989 | $275B | $3.0T |
| 1988 | $254B | $2.7T |
| 1987 | $240B | $2.4T |
| 1986 | $225B | $2.2T |
| 1985 | $219B | $1.9T |
| 1984 | $205B | $1.7T |
| 1983 | $176B | $1.4T |
| 1982 | $157B | $1.2T |
| 1981 | $142B | $1.0T |
| 1980 | $113B | $930.2B |
| 1979 | $96B | $845.1B |
| 1978 | $84B | $789.2B |
| 1977 | $69B | $718.9B |
| 1976 | $61B | $653.5B |
| 1975 | $55B | $576.6B |
| 1974 | $50B | $492.7B |
| 1973 | $45B | $469.1B |
| 1972 | $39B | $448.5B |
| 1971 | $36B | $424.1B |
| 1970 | $35B | $389.2B |
| 1969 | $30B | $368.2B |
| 1968 | $25B | $358.0B |
| 1967 | $23B | $344.7B |
| 1966 | $21B | $329.3B |
Interest payments represent seasonally adjusted annual rate at the end of Q4.
At current rates, the U.S. national debt is growing by a remarkable $1 trillion about every 100 days, equal to roughly $3.6 trillion per year.
As the national debt has ballooned, debt payments even exceeded Medicaid outlays in 2023—one of the government’s largest expenditures. On average, the U.S. spent more than $2 billion per day on interest costs last year. Going further, the U.S. government is projected to spend a historic $12.4 trillion on interest payments over the next decade, averaging about $37,100 per American.
Exacerbating matters is that the U.S. is running a steep deficit, which stood at $1.1 trillion for the first six months of fiscal 2024. This has accelerated due to the 43% increase in debt servicing costs along with a $31 billion dollar increase in defense spending from a year earlier. Additionally, a $30 billion increase in funding for the Federal Deposit Insurance Corporation in light of the regional banking crisis last year was a major contributor to the deficit increase.
Overall, the CBO forecasts that roughly 75% of the federal deficit’s increase will be due to interest costs by 2034.

-

 Maps2 weeks ago
Mapped: Average Wages Across Europe
-

 Money1 week ago
Which States Have the Highest Minimum Wage in America?
-

 Real Estate1 week ago
Ranked: The Most Valuable Housing Markets in America
-

 Markets1 week ago
Charted: Big Four Market Share by S&P 500 Audits
-

 AI1 week ago
The Stock Performance of U.S. Chipmakers So Far in 2024
-

 Automotive1 week ago
Almost Every EV Stock is Down After Q1 2024
-

 Money2 weeks ago
Where Does One U.S. Tax Dollar Go?
-

 Green2 weeks ago
Ranked: Top Countries by Total Forest Loss Since 2001